After almost 211 days without a correction of any kind, markets finally took a break here in September. Political tensions/drama, continued supply chain challenges, and the rising cost of energy all came together to shake investor confidence.
Looking back, August and September are historically the weakest months of the calendar year for the market, and that showed here in 2021. Looking ahead, the 4th quarter has been historically the best.
We’ve got a big holiday season right around the corner in the midst of a supply chain that is scrambling to reorganize itself. Looking into the end of the year, we still have a lot to be optimistic about regardless of the looming risks that exist. We can see continued volatility and are curious to see if the “buy the dip” mentality continues to be a common theme in broader markets.
During times like this our house view is to stay disciplined and balanced in your investment approach and not to try to chase market trends. Through the rest of this letter, you’ll see some of the things we’ve got our sights set on as both opportunities and risks in the markets.
Key Points
- Secular Bull Market: Earnings continue to drive the bull market.
- Cyclical Recovery: The cyclical recovery has downshifted to mid-cycle.
- Risks: Acute supply challenges are dramatically impacting energy markets.
- Mean Reversions: Investors keep investing into bonds.
Secular Bull Market
The fundamental source of equity values is earnings growth and sustainability. The market assigns a valuation level based on the collective judgment of market participants evaluating those earnings. Of course, there are times and moments in markets where a narrative or hype cycle takes over, but that is usually fleeting. Earnings are the source of value for investors. Professional investors discount expected earnings based on prevailing interest rates. The concept is that future earnings are not as valuable as cash received in the present. Higher interest rates reduce the present value of future earnings, so they lower equity market valuations. Lower interest rates on the other hand, allow for higher valuation levels than during high interest rates regimes. This approach is really making an adjustment for assuming equity risk and receiving an uncertain future return relative to receiving a consistent income stream from owning bonds.
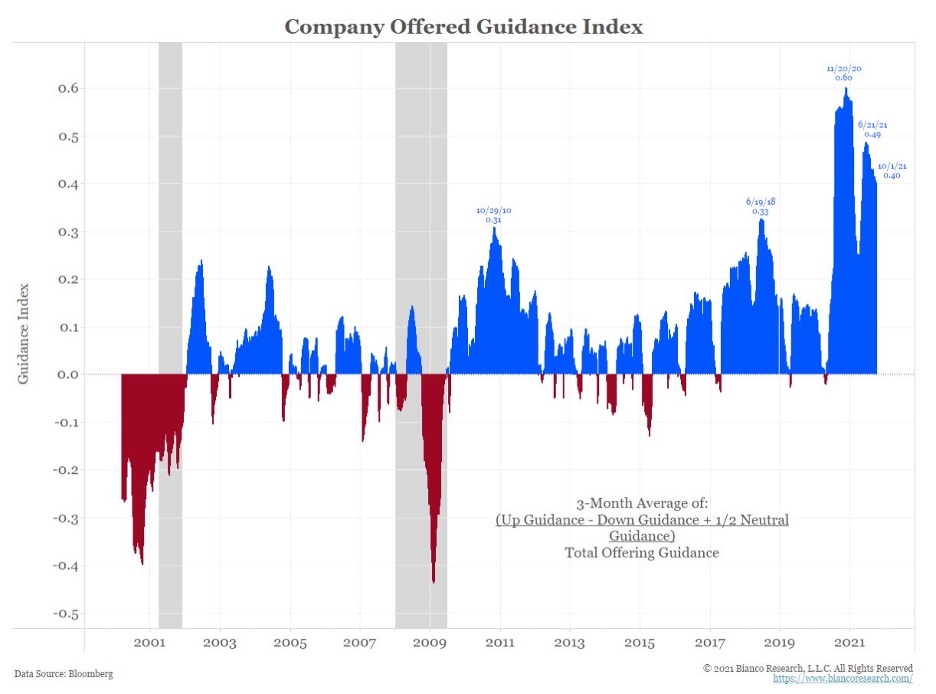
Earnings have been a big bright spot for the equity market. Earnings growth has been quite strong since 2010. Some commentators have argued that stocks are trending higher because of easy monetary policies. While low interest rates do allow for generally higher than average valuation multiples, earnings growth has been highly supportive of stock price appreciation. Another important factor is evaluating company guidance (a company’s best estimate of their own upcoming earnings that they release to investors). Since 2010, earnings guidance offered by companies has largely been positive and the negative guidance has been relatively minor. This is in contrast to the 2000’s secular bear market where company guidance was very weak with often starkly negative guidance. [See Figure 1]
Figure 1: Earnings Guidance
Cyclical Recovery
The cyclical recovery that started last year is now firmly in mid-cycle slowdown. Our comments from the third quarter letter remain relevant:
“As the market prepares to downshift expectations as part of the mid-cycle transition, some mild market weakness may develop. There is nothing wrong with a shift to a mid-cycle, it is short-term and normal market activity. This shift is not an indication of a change in long-term trend. It can best be described as the market adjusting to current conditions. Any weakness that may develop is more likely a long-term buying opportunity.”
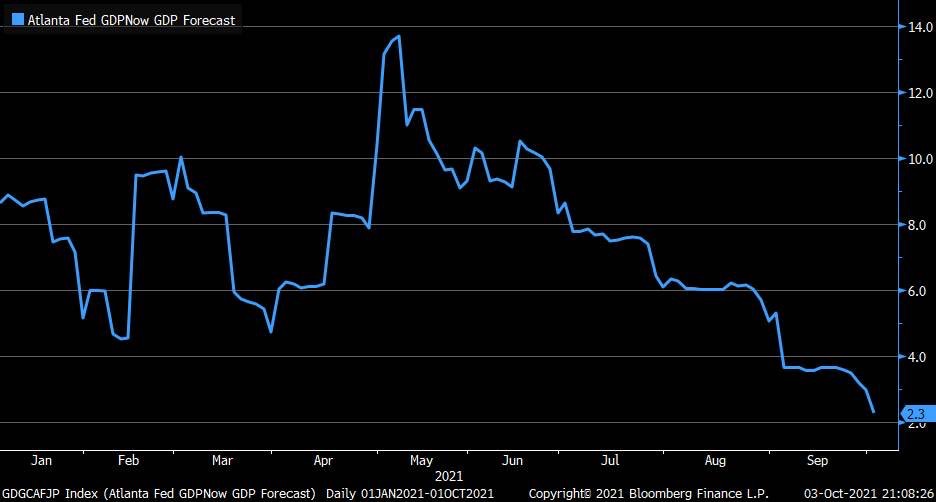
A mid-cycle slowdown is not a recession, but it is where some economic or market stresses show up. The first of these stresses is clearly showing up in supply chain disruptions. There are port delays and increased shipping costs. This is putting upward pressure on prices and maintaining higher inflation than the Federal Reserve would prefer to see. Higher prices from the re-opening impulse are impacting affordability. Affordability conditions in autos and homes have dropped sharply to slowdown type of levels. This is all contributing to a slowdown in GDP growth rates. [See Figure 2]
Figure 2. GDP Estimate
Risks
The risks look heavily tilted to the energy markets. Several problems have emerged. Oil prices have rebounded above $70/barrel, which is above where they were prior to the pandemic. However, the oil rig count is about half of what it was prior to the pandemic. In other words, it will not take too much for an acute supply crunch to develop. In the UK and Europe, natural gas prices have doubled abruptly. At the same time, Russia has reduced its natural gas exports. China has run out of coal and is experiencing rolling blackouts. Part of this is due to China imposing aggressive trade sanctions against Australia, who is no longer exporting coal to China. Normally higher prices bring about higher supply, but supply is well behind where it normally would be at this point in the cycle for oil, natural gas, and coal markets.
Mean Reversions
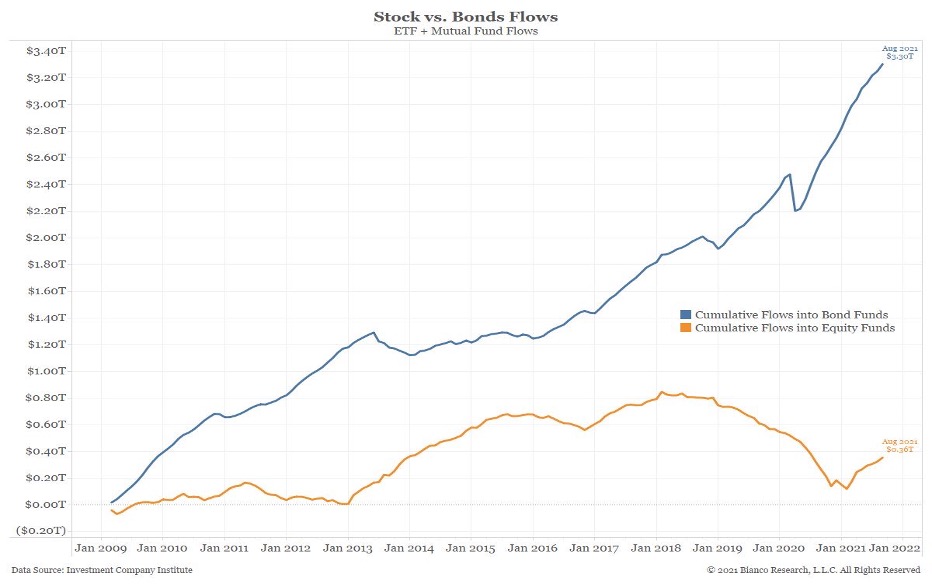
The term Mean Reversions is a form of analysis that looks at relative differences and looking for extremes that could reverse. During the last year and a half, there has been a bit of a see-saw pattern between growth and value stock leadership. This has been the energy and technology sectors relative performance patterns. For a few months energy outperforms and then it switches to technology and then back again. The US continues to lead world equity markets, but the cheapest large market relative to its 25-year average valuation is Japan, which may be poised for some catch-up, helping international allocations. The most fascinating figure might be the relative difference in stock fund versus bond fund flows over the last decade. While stocks have been in a secular uptrend, bonds sport yields well below average. However, investors have poured about 10 times more money into bond funds than stocks funds. [See Figure 3]
Figure 3. Stocks vs. Bond Flows
As always, if you would like to discuss your portfolio or re-visit your risk profile, please do not hesitate to contact us.
|
Ready to Take The Next Step?
For more information about any of the products and services listed here, schedule a meeting today or register to attend a seminar.